
Blog
How Professional Traders Use the Best MT5 Indicators for Day Trading
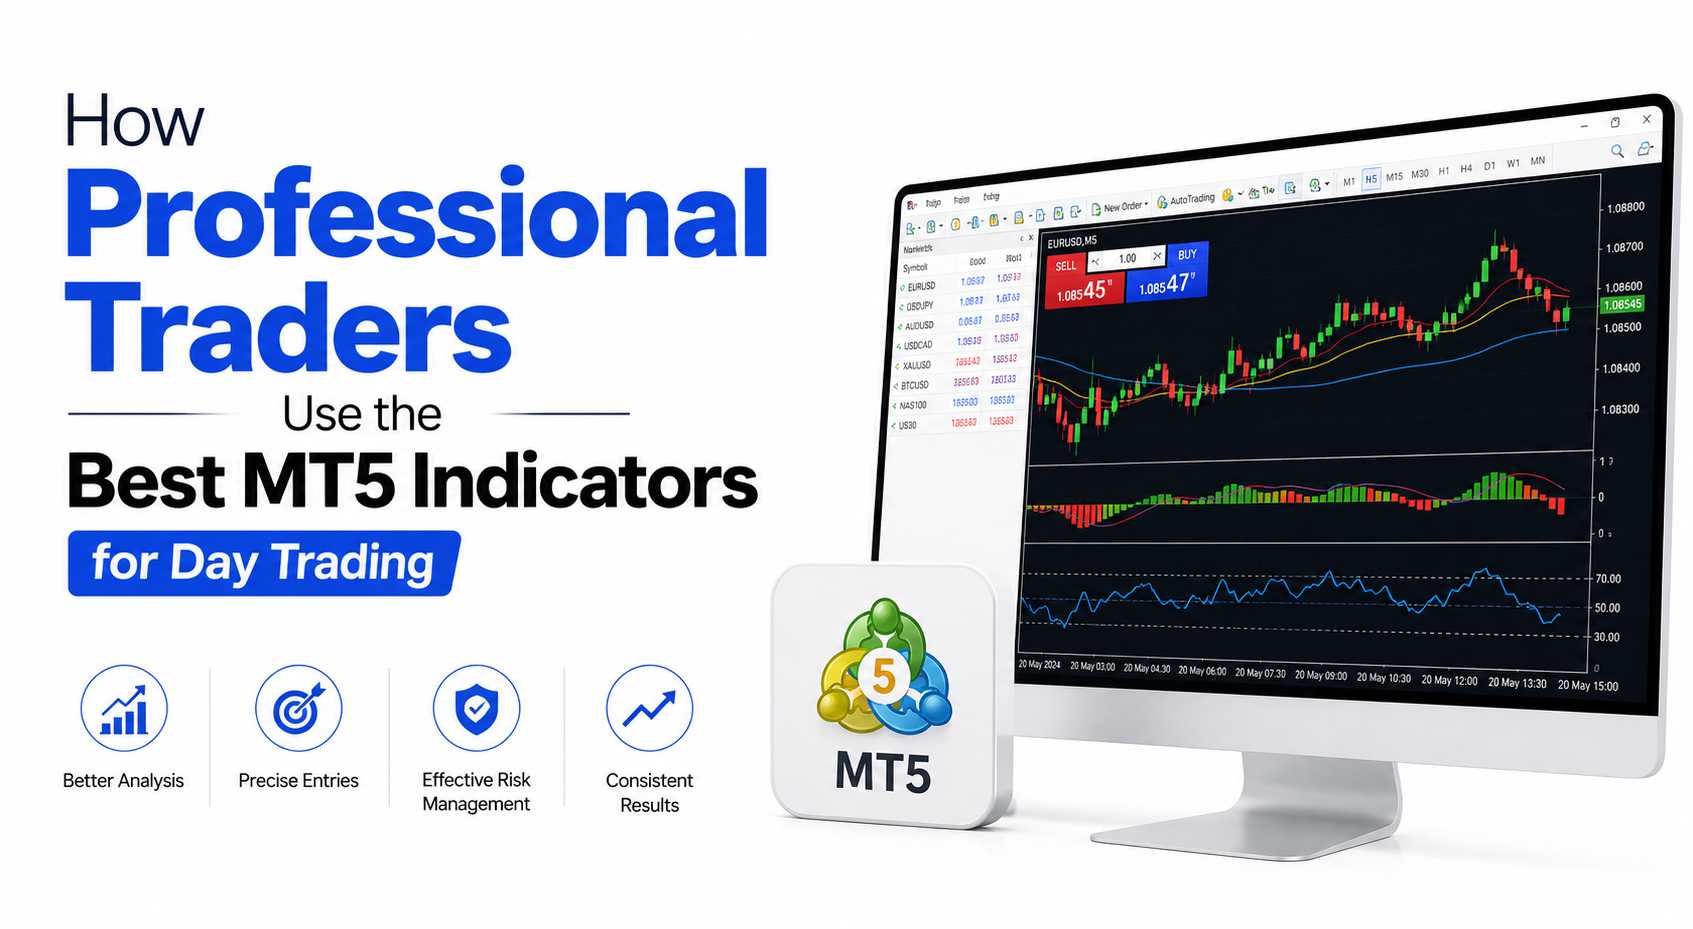
Are you planning to get into day trading? Then you need to understand one important thing first. Day trading is not only about opening and closing trades quickly. It needs speed, focus, patience, planning, and the right tools.
Professional traders do not depend on guesswork. They do not enter trades only because the market “looks good” or because they feel something may happen. Instead, they use data, charts, price movement, and technical indicators to make better trading decisions.
MetaTrader 5, also known as MT5, is one of the most popular platforms used by traders for this purpose. It gives traders access to useful indicators, different chart types, timeframes, and market analysis tools. When used properly, these tools can help traders understand market direction, find better entry points, and manage risk more carefully.
However, it is also important to remember that no indicator can guarantee profit. Indicators are only tools. They support decision-making, but traders still need discipline, risk control, and a clear trading plan.
Why MT5 Is the Preferred Platform for Day Traders
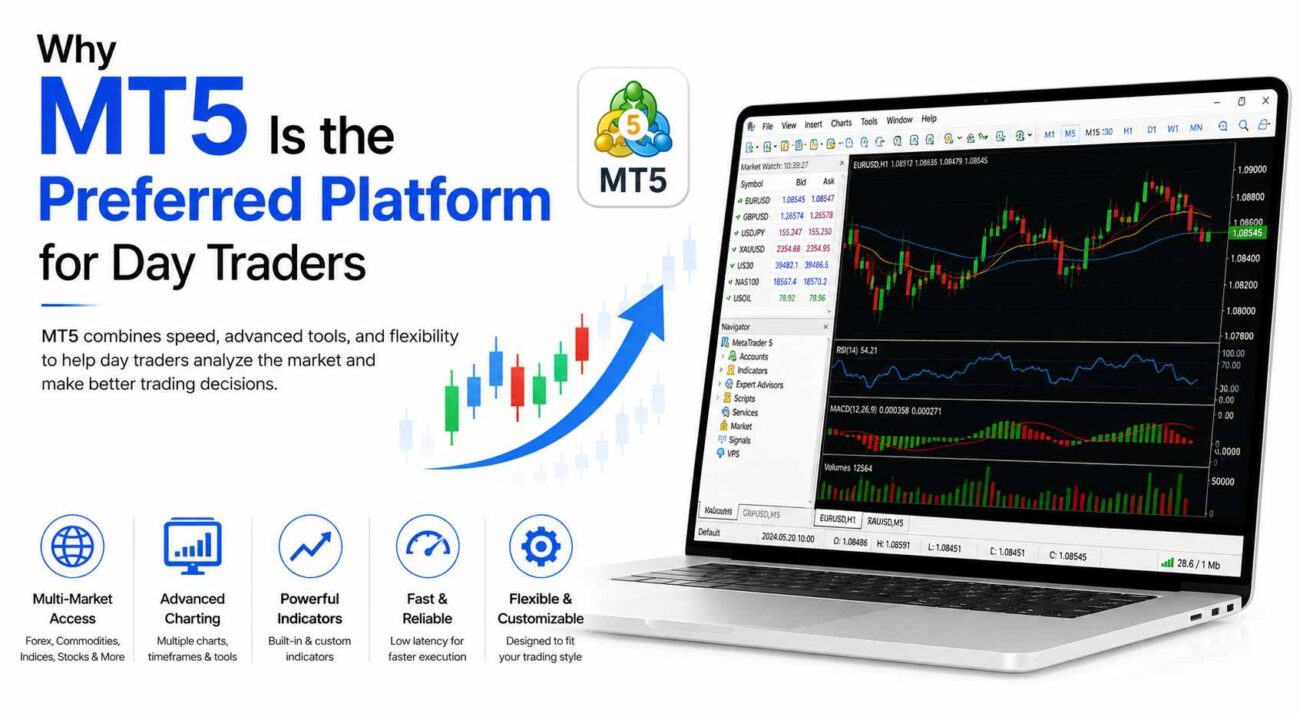
MT5 has become a popular choice for both beginner and professional traders because it offers many useful features in one place. Day traders need a platform that is fast, clear, and flexible. MT5 provides these benefits and helps traders study the market more easily.
One major reason traders prefer MT5 is that it supports different types of markets. Traders can use it for forex, commodities, indices, stocks, and other trading instruments, depending on the broker they use. This makes it useful for traders who want to watch more than one market.
MT5 also provides advanced charting tools. Traders can open different charts, use different timeframes, and apply several indicators to study price action. This is helpful because day traders often need to look at short-term price movements while also checking the bigger market direction.
For example, a trader may use a 5-minute chart to find an entry, a 15-minute chart to confirm momentum, and a 1-hour chart to understand the larger trend. This wider view helps traders avoid making quick decisions without enough information.
MT5 also has a large library of built-in indicators. These include moving averages, RSI, MACD, Bollinger Bands, volume tools, and many others. In addition, traders can also install custom indicators depending on their strategy.
This flexibility is one reason many traders look for the best MT5 indicators for day trading, because the right setup can make technical analysis easier and faster.
How Indicators Improve Day Trading Decisions
Indicators help traders read the market in a more organized way. Instead of looking at a chart and guessing what may happen next, traders use indicators to study trends, momentum, price strength, volatility, and possible reversal points. This is why many experienced traders understand the value of using the best MT5 indicators for day trading, as these tools make market analysis easier and help support better trade timing.
For example, a moving average can show whether the market is moving upward, downward, or sideways. RSI can help show whether the market may be overbought or oversold. MACD can help identify changes in momentum.
Professional traders often combine more than one indicator. This is because one indicator alone may not give enough confirmation. A moving average may show the trend, but it may not clearly show whether the trend is losing strength. An oscillator like RSI or MACD can help confirm that information.
A simple example would be this: if the price is above a moving average and RSI is also showing strong momentum, the trader may see this as a stronger signal. But if the moving average shows an uptrend while RSI is weak, the trader may wait for clearer confirmation.
This type of combined analysis can help reduce poor entries. It does not remove risk, but it gives traders a more structured way to make decisions.
Why Professional Traders Do Not Use Too Many Indicators
Many beginners make the mistake of adding too many indicators to their charts. They think that more indicators will give better signals. In reality, too many indicators can make the chart confusing.
Professional traders usually keep their setup simple. They choose a few useful indicators that match their strategy. Their goal is not to fill the screen with tools. Their goal is to understand the market clearly.
For example, a simple day trading setup may include:
| Indicator Type | Purpose |
|---|---|
| Moving Average | Shows trend direction |
| RSI | Measures momentum and overbought or oversold areas |
| MACD | Confirms trend strength and momentum changes |
| Volume Tool | Shows market activity |
| Statistics Tool | Tracks trading performance |
This kind of setup is easier to manage. It gives the trader enough information without creating too much confusion.
Common MT5 Indicators Used by Professional Traders
Professional traders use different indicators depending on their trading style. Some focus on trend-following strategies, while others focus on reversals, breakouts, or scalping. Still, there are some common indicators that many day traders use regularly.
Moving Averages
Moving averages are among the most used indicators in day trading. They help traders identify the general market direction. If the price is above a moving average, the market may be in an uptrend. If the price is below it, the market may be in a downtrend.
Many traders use two moving averages together. For example, they may use a short-term moving average and a long-term moving average. When the short-term average crosses above the long-term average, it may show a possible buying opportunity. When it crosses below, it may show a possible selling opportunity.
This method is popular among intraday forex traders because it is simple and easy to understand. However, traders should not use moving averages alone. They work better when combined with price action and other confirmation tools.
Relative Strength Index
The Relative Strength Index, also called RSI, is used to measure momentum. It helps traders understand whether the market may be overbought or oversold.
When RSI moves very high, it may suggest that the market is overbought. This means the price may have moved up too quickly and could slow down or reverse. When RSI moves very low, it may suggest that the market is oversold. This means the price may have dropped too quickly and could bounce back.
Day traders often use RSI during market swings. It can help them confirm possible reversal areas. However, RSI should be used carefully because strong trends can stay overbought or oversold for a long time.
MACD Indicator
MACD is another popular indicator used by traders. It helps identify momentum changes and trend direction. Traders often use MACD to see whether market strength is increasing or weakening.
When MACD lines cross, it may show a possible change in momentum. Traders may use this as a signal to watch for entry or exit opportunities. Many professionals combine MACD with price action, support and resistance, or moving averages.
MACD is useful because it can show both trend and momentum. But like other indicators, it is not perfect. It can sometimes give late signals, especially in fast-moving markets.
Volume and Market Activity Tools
Volume tools help traders understand how active the market is. Higher volume can show stronger interest from buyers or sellers. Lower volume may show weak market participation.
In day trading, volume can be useful when checking breakouts. If the price breaks an important level with strong volume, the move may have more strength. If price breaks a level with low volume, the move may be weaker and less reliable.
Professional traders also pay attention to market activity because it helps them avoid poor trading times. For example, some traders avoid entering trades when volume is too low or when the market is moving sideways.
Trade Statistics Tools
Professional traders do not only focus on finding trade entries. They also review their performance. This is where tools like the trade statistic indicator for MT5 can be useful.
A trade statistics tool can help traders track important details such as win rate, loss rate, average profit, average loss, and overall trading performance. This helps traders understand whether their strategy is working or not.
For example, a trader may notice that they win many small trades but lose too much on a few bad trades. This shows that their risk management needs improvement. Another trader may notice that they perform better during certain market sessions and worse during others.
By reviewing statistics regularly, traders can improve their strategy and avoid repeating the same mistakes.
How Signal Dashboards Help Day Traders
Day traders often watch several currency pairs or markets at the same time. This can be difficult if they have to check every chart manually. A dashboard can make this process easier.
A forex day trading signals dashboard for MT5 can show alerts, trend direction, market strength, and possible trading conditions across different pairs. This saves time and helps traders notice opportunities faster.
For example, instead of opening ten different charts, a trader can look at one dashboard and quickly see which pairs are trending, which pairs are weak, and which ones may be forming trade setups.
This does not mean traders should unthinkingly follow every signal. A dashboard should be used as a support tool. Professional traders still check the chart, confirm the setup, and apply risk management before entering a trade.
How Professional Traders Combine Indicators
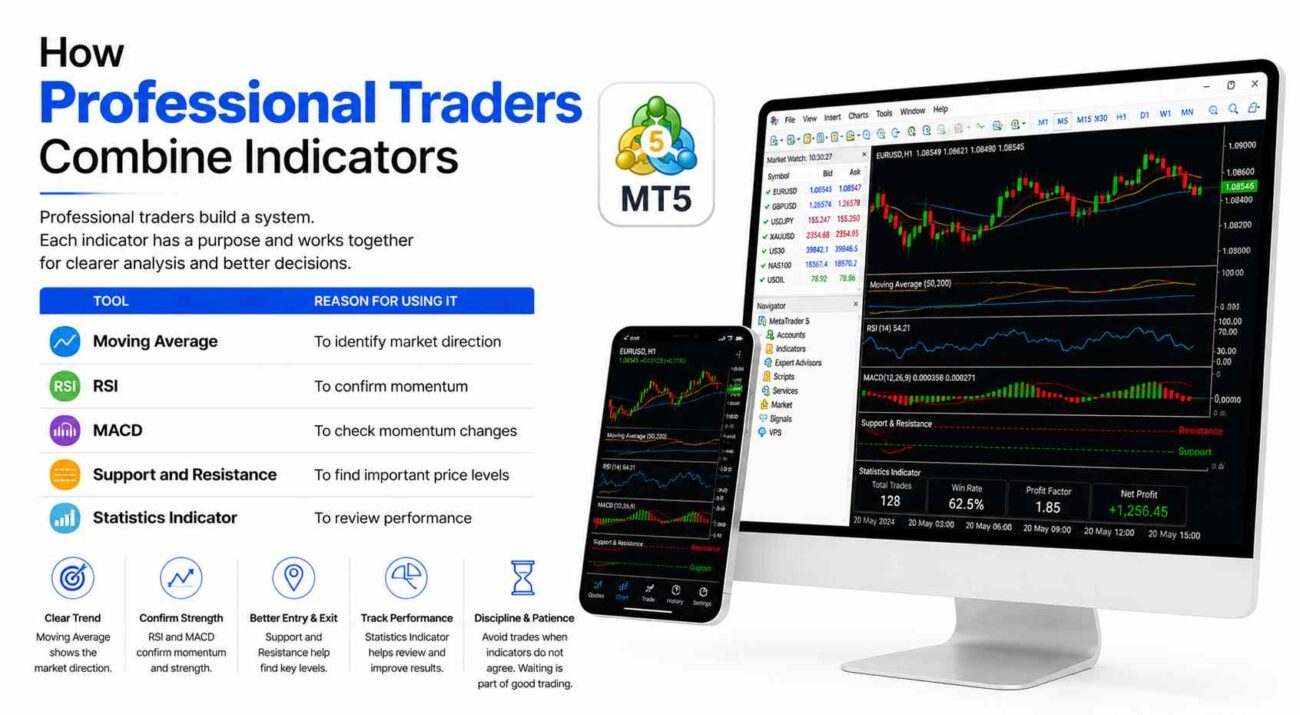
Professional traders usually build a system. They do not randomly add indicators and hope for the best. Each indicator has a purpose.
For example, a trader may use:
| Tool | Reason for Using It |
|---|---|
| Moving Average | To identify market direction |
| RSI | To confirm momentum |
| MACD | To check momentum changes |
| Support and Resistance | To find important price levels |
| Statistics Indicator | To review performance |
This creates a more balanced approach. The moving average tells the trader the trend. RSI and MACD help confirm strength. Support and resistance show possible entry and exit zones. The statistics tool helps the trader improve over time.
A professional trader may also avoid taking a trade if the indicators do not agree. For example, if the moving average shows an uptrend but RSI is weak, and volume is low, the trader may wait. Waiting is also part of good trading.
Importance of Price Action
Indicators are helpful, but price action is also very important. Price action means studying how the price moves on the chart. This includes candles, support and resistance, trendlines, breakouts, pullbacks, and market structure.
Professional traders often use indicators with price action. They do not depend only on indicator signals. For example, if RSI shows oversold conditions near a strong support level, the trader may see this as a stronger signal than RSI alone.
This is why traders should learn to read charts properly. Indicators can support the analysis, but the price itself is still the main source of information.
What Is the Place of Risk Management in Day Trading?
Even with strong indicators, traders cannot guarantee profit on every trade. Losses are part of trading. Professional traders understand this clearly, so they focus heavily on risk management.
Risk management helps protect the trading account. A trader may have a good strategy, but without risk control, one or two bad trades can cause serious damage.
Professional traders often use stop-loss orders. A stop-loss helps limit loss if the trade goes in the wrong direction. They also use position sizing rules, which means they decide how much money to risk on each trade.
Many traders also set daily risk limits. For example, they may decide to stop trading for the day after a certain loss limit is reached. This helps prevent emotional trading and revenge trading.
Risk management is not exciting, but it is one of the most important parts of day trading. Indicators can help find trade setups, but risk management helps protect the trader from major losses.
Why Discipline Matters More Than Signals
A trading signal is only useful if the trader follows a plan. Many beginners enter trades too early, exit too late, move their stop-loss, or trade too much after a loss. These habits can damage performance.
Professional traders are more disciplined. They wait for their setup. They follow their rules. They do not chase every market move. They also accept losses as part of the process.
Discipline helps traders stay consistent. Without discipline, even the best indicators may not help. A trader may have a strong setup but still lose money because of emotional decisions.
This is why a trading plan is important. A good plan explains when to enter, when to exit, how much to risk, and when to stop trading.
Common Mistakes Beginners Should Avoid
Many new traders make similar mistakes when they start using MT5 indicators. One common mistake is depending on indicators too much. Indicators are helpful, but they should not replace learning and planning.
Another mistake is changing strategies too often. Some traders use one setup for a few days, then switch to another one after a loss. This makes it hard to know whether a strategy actually works.
Overtrading is another common problem. Day traders may feel they need to trade all the time. But professional traders know that not every market movement is a good opportunity.
Beginners should also avoid using large lot sizes without proper experience. Bigger trades can lead to bigger losses. It is better to start small, practice carefully, and focus on learning.
Conclusion
Professional traders use MT5 indicators to improve accuracy, study market direction, confirm momentum, and manage trades more efficiently. These tools help traders make more organized decisions instead of relying on emotions or guesswork.
MT5 is useful because it offers advanced charts, multiple timeframes, built-in indicators, custom tools, dashboards, and performance tracking options. However, indicators are not magic. They cannot remove risk or guarantee profit.
The best approach is to combine technical indicators with price action, risk management, and discipline. Traders who follow a clear plan and review their performance regularly are usually better prepared than those who trade randomly.
For anyone starting day trading, the goal should not be to find a perfect indicator. The goal should be to build a simple, clear, and well-managed trading system that supports better decision-making over time.
Disclaimer: This article is for educational purposes only. Day trading involves risk, and losses can happen. Always do your own research and consider practicing on a demo account before trading with real money.