
Do Stock Swings Forecast Marketplace Demand?

Stock prices go up and down every day. But can these changes tell us something useful about what customers want to buy?
This question matters for business owners, marketers, investors, and anyone trying to anticipate consumer trends before they become obvious.
The short answer is: sometimes, yes.
Stock movements can offer early hints about changes in customer demand—but only when you know what to look for and how to filter out the noise. This guide explains how to use stock swings as an early signal for shifts in marketplace activity.
How Stock Prices Connect to Customer Behavior
Basic Relationship
When investors buy shares in a company, they’re essentially betting on its future performance. And for most companies, that future depends on customer spending. So, stock prices often move before we see the change in actual sales or transaction data.
Key connections between stock prices and demand:
- Rising stock prices may signal growing customer interest.
- Falling prices can hint at declining demand or weaker confidence.
- Sudden jumps might reflect positive news about customer growth or expansion.
- Sharp drops could indicate problems with customer retention or economic uncertainty.
Examples
Think about rideshare platforms like Uber or Lyft. When their stock prices climb steadily, it might mean:
- More people are booking rides.
- Average spending per trip is increasing.
- The company is expanding into new regions.
- Broader economic conditions are supporting more mobility.
Similarly, a food delivery platform’s stock rally could indicate that more households are ordering meals rather than cooking at home.
Pro Tip: Stock movements tied to companies directly connected to consumer activity (transport, retail, delivery, payment processors) tend to give stronger signals than stocks in capital-heavy industries.
Why This Matters for Business Planning
Most businesses get their sales reports weekly or monthly, while stock markets react in minutes.
This timing gap creates opportunities for operators who track investor behavior closely.
| Benefit | How It Helps |
|---|---|
| Faster decisions | Adjust marketing campaigns before competitors react |
| Better inventory | Stock up or reduce orders ahead of demand changes |
| Smarter staffing | Schedule employees based on anticipated footfall |
| Budget planning | Allocate resources to areas with early signs of growth |
For example, if a major delivery company’s stock surges 10% over three days, this might signal upcoming higher order volume in urban areas—giving restaurants, grocery stores, or suppliers a 3–7 day lead time to prepare.
Understanding Time Delays Between Stock Moves and Demand Changes
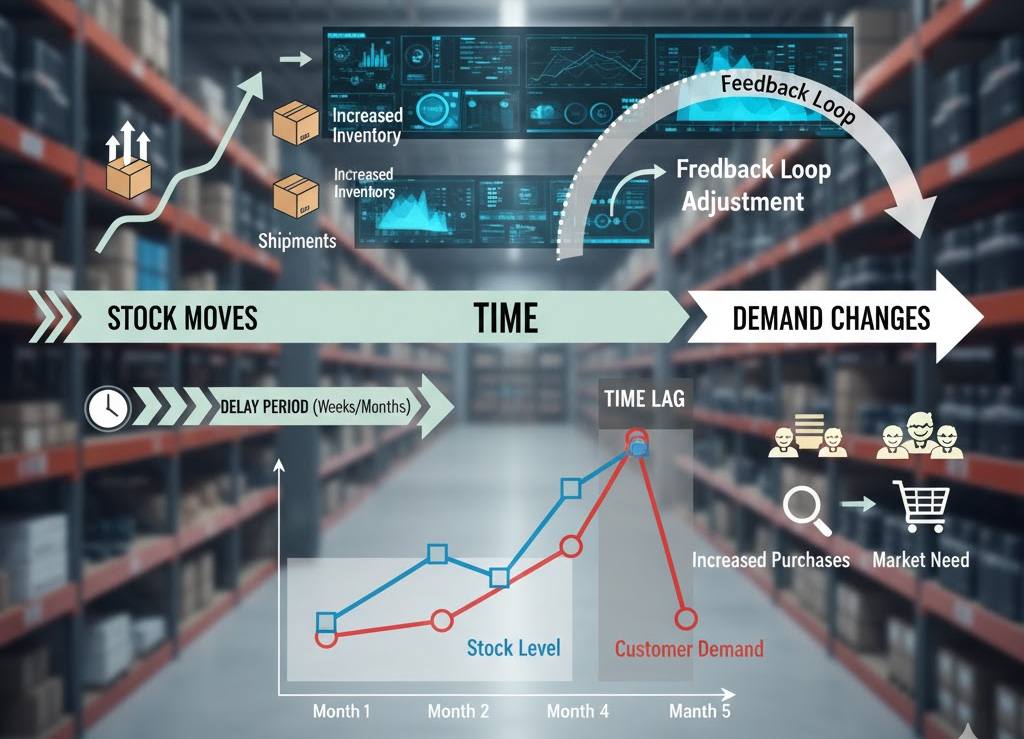
Lag Period
Stock prices don’t instantly translate into customer behavior.
There’s usually a lag, a delay between stock market moves and when businesses actually see demand shift.
| Industry Type | Typical Lag | Examples |
|---|---|---|
| Short-term (1–7 days) | Fast | Food delivery, ride-sharing, quick commerce |
| Medium-term (1–4 weeks) | Moderate | Retail shopping, entertainment, travel bookings |
| Long-term (1–3 months) | Slow | Home goods, large purchases, subscription services |
How to Measure the Lag
Business analysts often use a method called rolling window analysis:
- Track your daily or weekly sales/orders.
- Track stock prices of related companies.
- Overlay both data sets over time.
- Spot where stock movements appear before demand changes.
- Measure the typical delay in days or weeks.
Example: Energy Costs and Transportation
When oil prices drop, transportation and delivery company stocks often rally.
Within 2–3 days, delivery platforms frequently see order volumes increase because lower fuel costs lead to cheaper delivery fees.
Research by the National Bureau of Economic Research shows that consumer spending on transportation responds to cost changes with a median lag of 5–10 days.
Businesses that track these early signals can plan logistics, marketing, and promotions more effectively.
Using Competitor Analysis to Confirm Signals
Why Look at Multiple Companies
A single company’s stock movement doesn’t always tell the full story.
But when several competitors move in the same direction, the signal becomes stronger.
Validation checklist:
- Are multiple stocks in the same industry moving together?
- Are pricing changes happening across several competitors?
- Is customer behavior aligning across platforms?
- Do transaction volumes confirm the pattern?
Practical Cross-Checking Method
- Identify your direct competitors.
- Track their stock prices daily.
- Monitor their pricing or promotional actions.
- Compare patterns with your own demand data.
- Look for consistent trends across multiple sources.
Example Scenario
| Company | Stock Change | Pricing Action | Your Demand Change |
|---|---|---|---|
| A | +8% | Reduced delivery fees | +12% orders |
| B | +6% | Launched promotions | +10% orders |
| C | +7% | Extended service hours | +11% orders |
When several companies show coordinated patterns, you can be more confident that the stock movement reflects real demand, not just investor speculation.
Factors That Create False Signals
Common Noise Sources
Not every stock movement reflects customer behavior. Stocks can move because of:
Financial Events
- Earnings announcements
- Executive changes
- Mergers and acquisitions
- Stock buybacks
- Dividend changes
External Forces
- Federal Reserve interest rate decisions
- Oil price shocks
- Currency fluctuations
- Trade policy shifts
- Regulatory announcements
How to Filter Out Noise
The Federal Reserve Bank of St. Louis (FRED) provides economic data that helps filter noise.
Simple filtering approach:
- Mark major events (earnings calls, Fed meetings, holidays).
- Exclude outlier days with market-wide shocks.
- Focus on multi-day trends, not single-day spikes.
- Always check the news to understand why a stock moved.
Hedge Fund Effect
Large hedge funds can push prices without any real demand changes.
For example, if a hedge fund buys millions of shares, the stock may surge—but customer demand hasn’t changed.
Warning signs of false signals:
- Unusual trading volume without clear news
- Stock moves in the opposite direction from its peers
- Movement during earnings blackout periods
- Price spikes on low-quality rumors
Filtering out these false signals prevents bad business decisions based on market noise.
Building a Simple Alert System
Why Automated Monitoring Matters
Manually checking stock charts every day isn’t scalable.
A basic alert system can help spot important trends in real time.
Components of an Effective System
- Stock price feeds (Yahoo Finance API, Alpha Vantage)
- Your own sales/order data
- Competitor pricing information (web scraping or market tools)
- Economic indicators (e.g., FRED Economic Data)
Setting Up Basic Alerts
Option 1: Spreadsheet Method
- Import stock data into Google Sheets.
- Add 7-day moving averages.
- Use conditional formatting to flag big changes.
- Set email alerts when thresholds are breached.
Option 2: Dashboard Tools
- Use Tableau, Power BI, or Looker Studio.
- Connect multiple data sources.
- Create visual alerts and automated notifications.
Choosing the Right Thresholds
| Alert Type | Threshold | Action |
|---|---|---|
| Stock surge | +5% in 3 days | Review demand forecasts |
| Stock decline | -5% in 3 days | Prepare for softer demand |
| Competitor pattern | 3+ companies move together | Trigger deeper market analysis |
| Correlation spike | Correlation > 0.7 | Update predictive models |
Practical Tips for Different Business Types
1. Retail Businesses
- Monitor major retailers’ stocks (e.g., Walmart, Target, Amazon).
- A sustained rally in these stocks may suggest strong consumer spending.
- Use this to time:
- Seasonal inventory purchases
- Launch marketing campaigns
- Hire temporary staff
2. Service Businesses
- Track stocks in discretionary spending sectors (restaurants, entertainment, travel).
- Rising stock prices here often reflect higher consumer confidence.
3. B2B Companies
- Watch stocks in your clients’ industries.
- If their sector is thriving, they may increase budgets for your services.
4. E-Commerce Businesses
- Track payment processors like PayPal and Square, plus logistics firms like FedEx and UPS.
- Their stock trends often reflect overall online shopping activity.
Understanding Market Sentiment and Trading UBER Stock
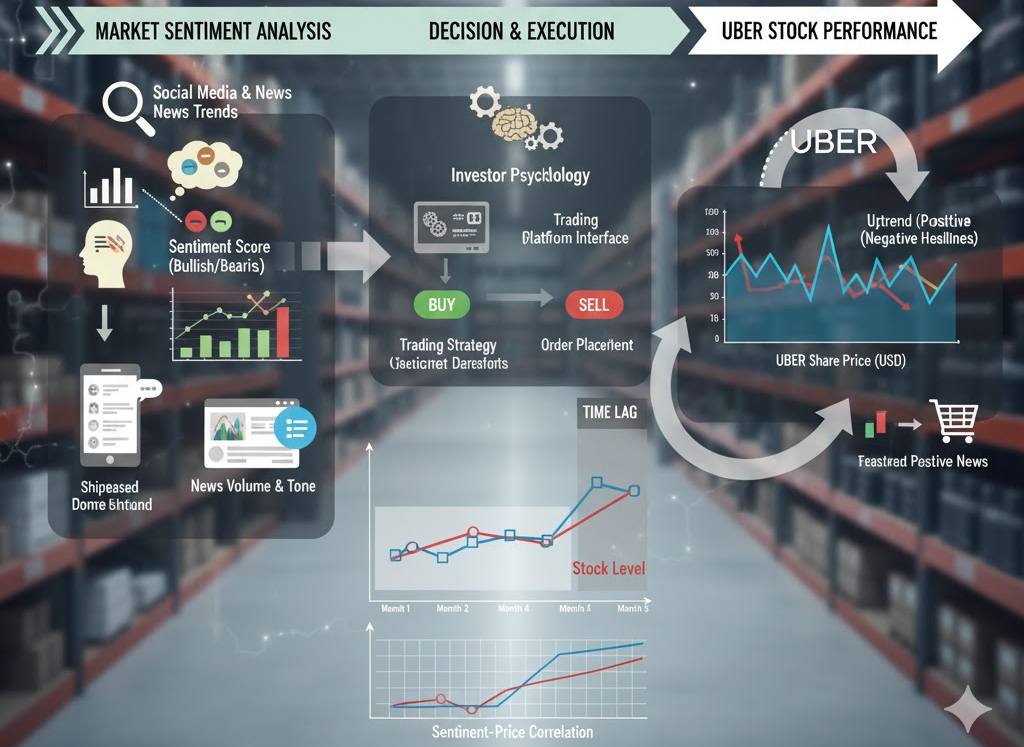
A major driver of stock movements is market sentiment — the collective mood and expectations of investors.
Even when fundamentals stay the same, optimism or fear can move stocks sharply.
For example, when trading UBER stock:
- A positive outlook on post-pandemic mobility can cause stock rallies, even before ride volume grows.
- A downturn in sentiment, even without operational issues, can push the price lower.
- These sentiment-driven swings can lead or lag actual marketplace demand.
Savvy businesses don’t react to every swing. Instead, they monitor when market sentiment aligns with operational signals—such as increased app activity, surge pricing, or traffic data.
Expert Insights and Best Practices
According to Harvard Business Review, top-performing companies don’t rely on one data stream.
They blend stock market signals with operational data to make faster, more confident decisions.
Key best practices:
- Start small — Track 2–3 relevant stocks first.
- Test your assumptions over 2–3 months.
- Document patterns of what worked or didn’t.
- Adjust quarterly as market conditions change.
- Combine with other data like web traffic, surveys, and economic indicators.
The U.S. Bureau of Economic Analysis provides consumer spending data that can help confirm whether stock-based signals align with real-world demand.
Common Mistakes to Avoid
- ❌ Overreacting to single-day movements
- ❌ Ignoring context behind price swings
- ❌ Following irrelevant stocks outside your industry
- ❌ Forgetting seasonality that can mimic demand changes
- ❌ Acting without multiple confirmations
Getting Started Today: A Simple 5-Step Plan
- Identify 3–5 public companies whose customer base mirrors your own.
- Set up free stock alerts (e.g., Google Finance, Yahoo Finance).
- Track their prices in a spreadsheet alongside your own sales data.
- Review weekly for one month.
- Spot repeatable patterns and adjust operations accordingly.
Even a small lead time of 3–7 days can be the difference between reacting and anticipating market changes.
Final Thoughts
Stock swings aren’t crystal balls. But when interpreted carefully, they can whisper clues about where customer demand is heading.
Businesses that use stock data effectively tend to:
- Stay curious and analytical.
- Combine multiple data sources.
- Act on patterns, not hunches.
- Adapt their strategy over time.
Whether you run a rideshare fleet, retail brand, delivery platform, or e-commerce store, watching market sentiment and key stock trends—like when trading UBER stock—can give you an early edge.
Start small, track carefully, and evolve your system.
In competitive markets, even a few days’ head start can make a big difference.
References & Further Reading
- Federal Reserve Bank of St. Louis (FRED)
- U.S. Bureau of Economic Analysis
- National Bureau of Economic Research
- Harvard Business Review
- Market Activity – Uber Technologies Inc. (UBER)
- Yahoo Finance API
- Alpha Vantage API